
Beyond One Reading: Wireless Greenhouse Monitoring in the Netherlands
A normal reading at a few points doesn't mean the whole greenhouse is fine. Distributed sensing reveals local hot and cold spots before uneven crops do.
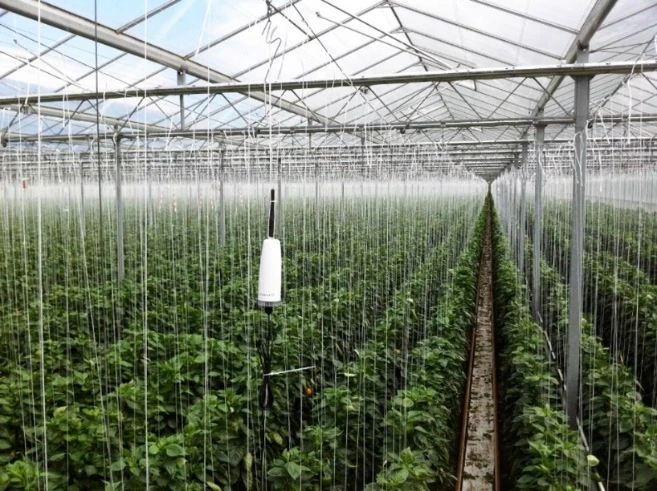
NHR greenhouse monitoring reference photo; it is not a verified site record of the trial described in this article.
Project Profile
- Region: Netherlands
- Setting: Commercial greenhouse monitoring
- Measured variables: Air temperature and humidity
- Core architecture: Battery-powered wireless sensors, multi-point deployment, remote monitoring
Confirmed Deployment Highlights
- Multi-point sensor matrix — More spatial detail than a small number of fixed readings
- Hot and cold spot visibility — Comparable temperature and humidity data across locations
- Scalable deployment — Sensor coverage can grow with the monitoring requirement
Case Snapshot
One temperature reading cannot describe what every crop row is experiencing. Sun exposure, airflow, equipment placement, and planting density can all create local differences inside the same greenhouse. When measurements come from only a few locations, operators see an average condition while missing a cold spot, hot spot, or humidity deviation developing elsewhere.
In this Netherlands application, publicly documented in 2014, several growers trialled a matrix of battery-powered wireless sensors. Temperature and humidity readings from multiple positions gave them a clearer picture of environmental variation and a better basis for adjusting greenhouse climate management.
The Challenge
A Normal Reading at One Point Does Not Mean the Whole Greenhouse Is Stable
Sparse fixed measurements are easy to maintain, but they cannot answer the operational question that matters most: which area is drifting, and is the deviation temporary or part of a persistent microclimate?
If uneven conditions are not noticed until crop development begins to diverge, the team is already investigating after the effect has appeared. A greenhouse-wide average can remain within range even while a local area needs closer inspection of ventilation, heating, misting, or another environmental-control component.
The Solution
Add Spatial Context with Distributed Wireless Sensing
The deployment used multiple battery-powered wireless sensors instead of relying on a small number of fixed values. Sensors at different locations collected temperature and humidity data, allowing operators to compare conditions, identify hot and cold spots, and expand coverage as monitoring needs changed.
The published material also describes remote multi-greenhouse viewing and threshold notifications as solution capabilities. Integration with heaters, fans, or misters was presented as an extension path, but the source does not confirm closed-loop automation at these trial sites. This case therefore treats sensing, remote visibility, and human climate decisions as the verified scope.
Operational Value
Move Climate Decisions from a Single Reading to Zone-Level Evidence
Multi-point data helps operators separate a greenhouse-wide issue from a local one. The published account says participating growers were able to steer the climate more effectively, reduce cold-spot risk, and support more uniform crop development.
No public record identifies the sensor count, greenhouse area, quantified savings, or yield gain. The defensible value is more fundamental: environmental differences that were difficult to see became comparable and trackable.
Frequently Asked Questions
Why is one temperature and humidity sensor not enough for a greenhouse?
A single sensor represents only its immediate location. Large greenhouses can develop local microclimates because of sunlight, airflow, equipment layout, and crop density. Multiple points are needed to compare zones and reveal hot or cold spots.
What did the documented trials measure?
The published account confirms that the early deployment focused on air temperature and humidity. Soil moisture, CO₂, pH, and other variables were described as expansion areas, not as equipment installed at every trial greenhouse.
Did the system automatically control greenhouse equipment?
The solution could be integrated with heating, fans, or misting, but the public source does not confirm that closed-loop control was active at these sites. The verified scope is environmental sensing, remote viewing, and decision support.
Are quantified energy savings or yield gains available?
No. The source reports qualitative improvements in climate steering, cold-spot prevention, and crop uniformity, but it does not provide independently verifiable energy, yield, or ROI figures.
Next Step
For a zone-level greenhouse monitoring plan, start with the growing zones, existing climate-control equipment, and the environmental decisions operators need to make. NHR can then help define sensing locations, connectivity, and platform integration without treating one reference layout as a universal design.
Explore Environmental and Agriculture Monitoring / Talk to an Expert
Image Gallery
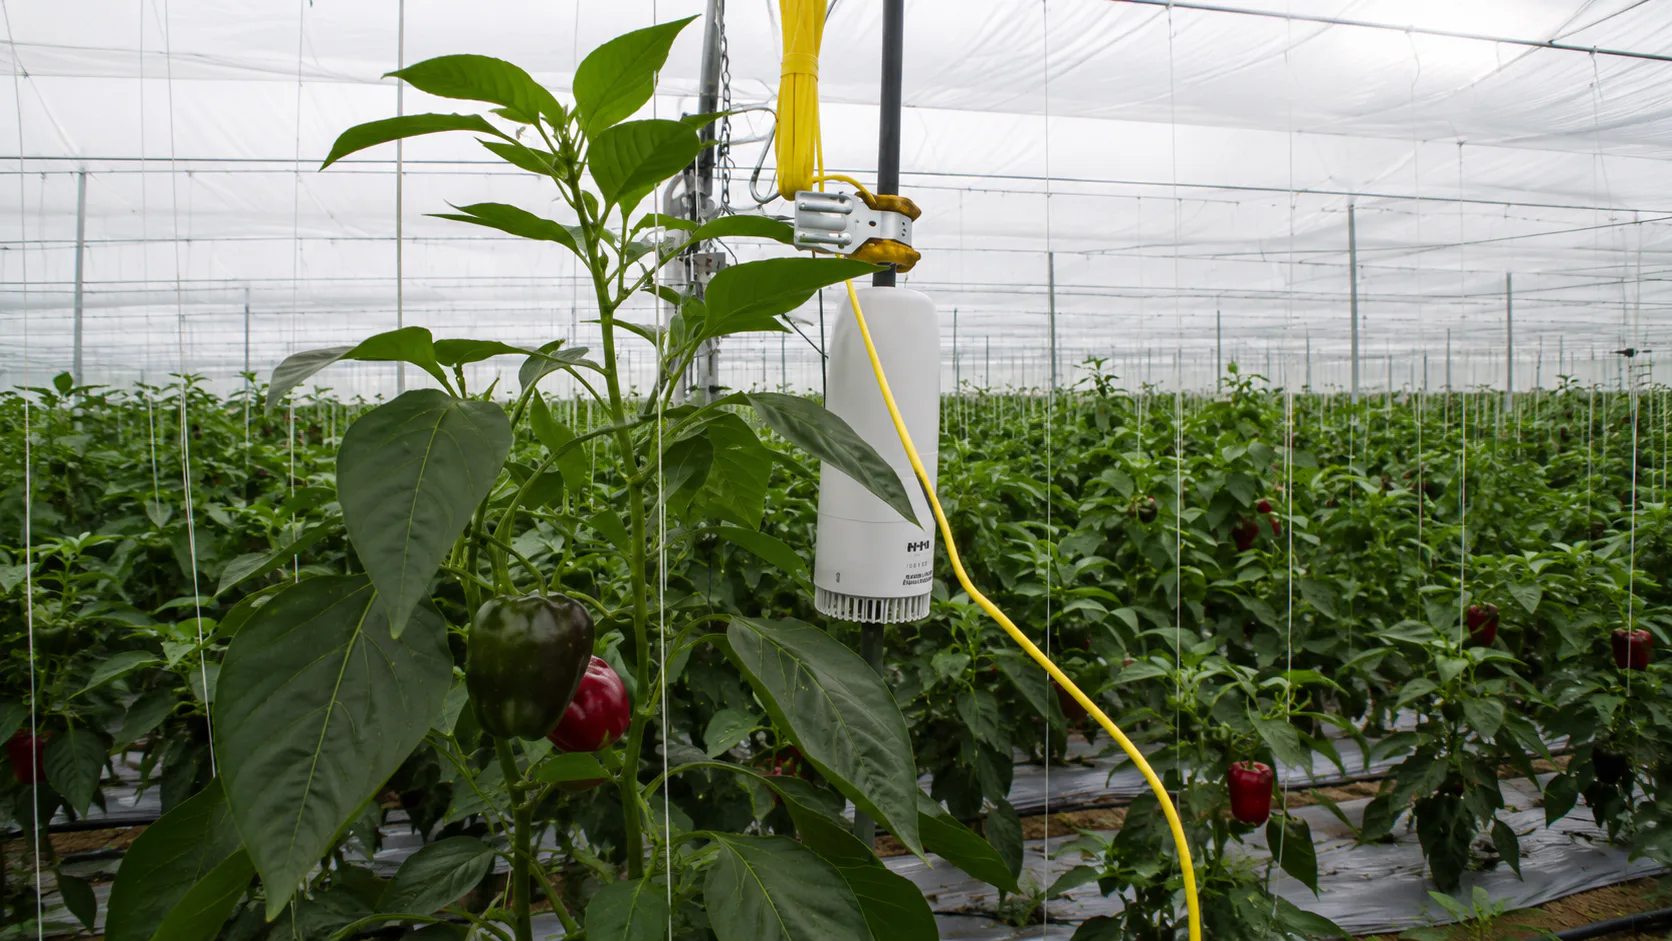
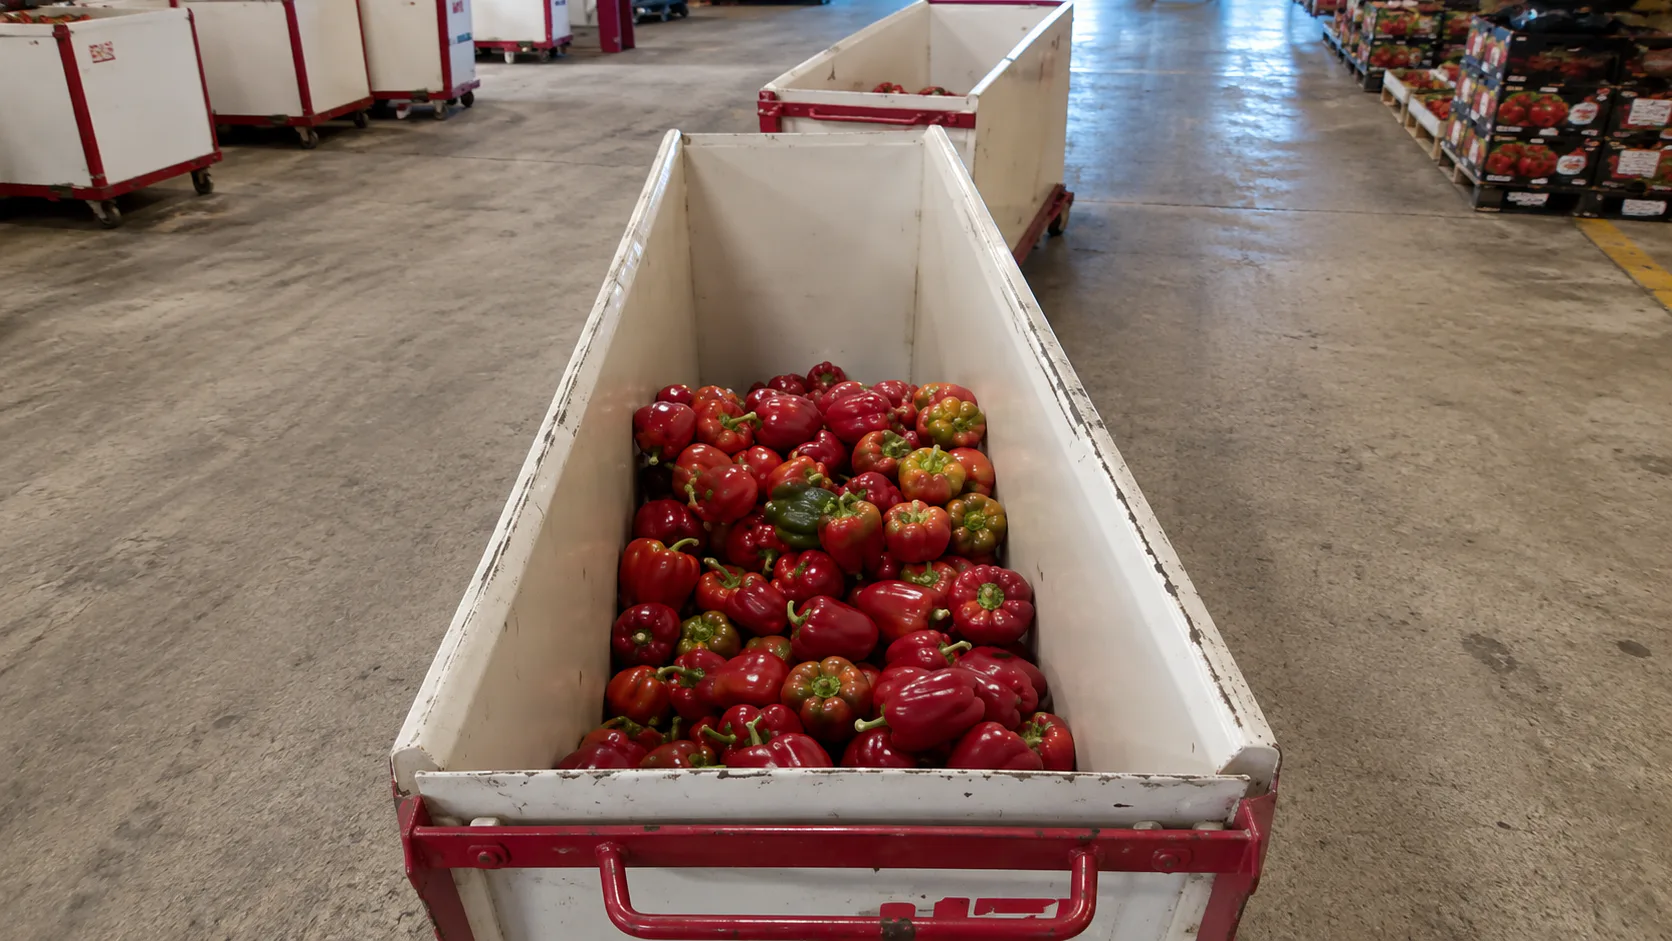
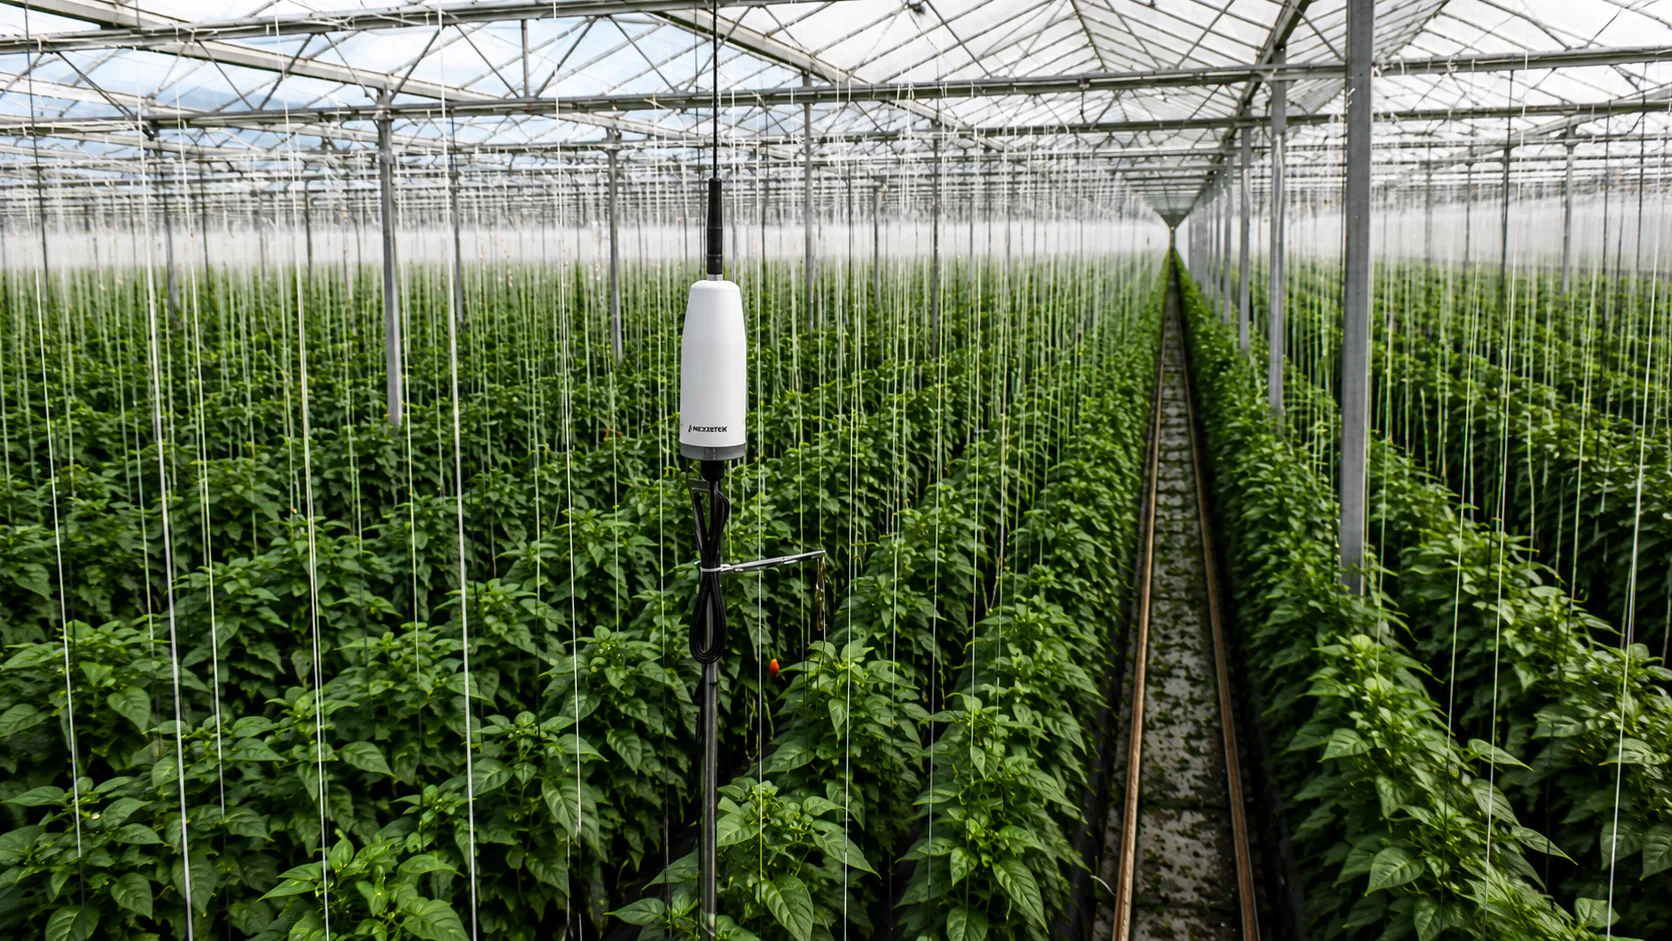
These images should be presented as scenario illustrations unless original files and publication rights establish them as site photographs.
Notes
- Every site is different; deployment plans and outcomes should be assessed by qualified professionals against actual site conditions.